

US Jobs Numbers Aren't as Bad as They Look
It's Probably Not AI—Shrinking Immigration Has Changed the Math on What "Good" Job Growth Means


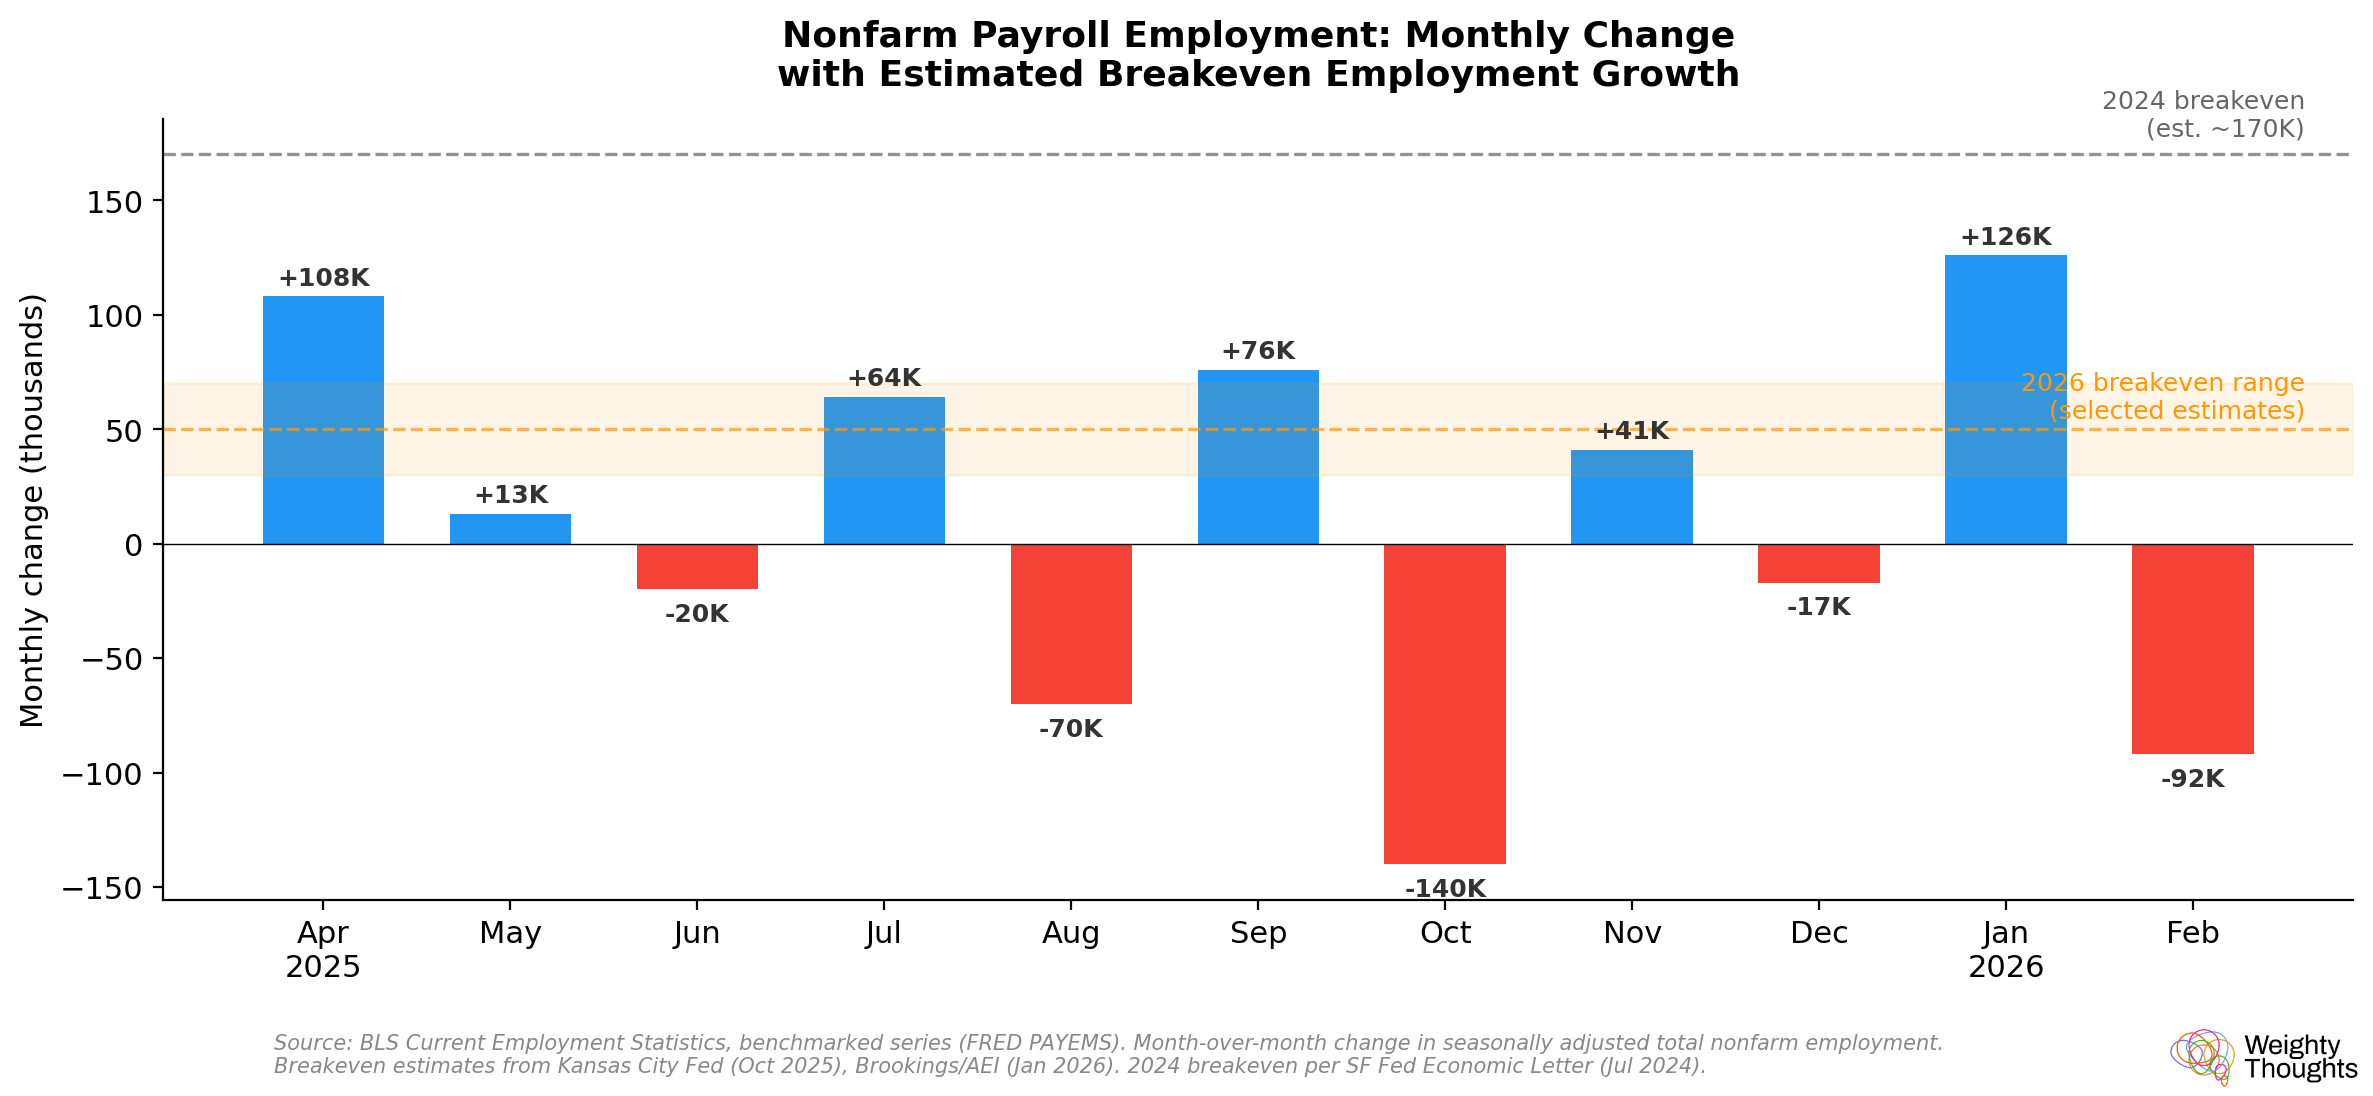
It’s a little dated now, but the February jobs report landed like a grenade. Payrolls fell by 92,000—the third decline in five months—and the December number got revised down to negative 17,000. Headlines did what headlines do. “Economy Sheds Jobs.” “Worst Report Since the Pandemic.”
This, of course, plays into everyone freaking out about AI destroying jobs and creating a “jobless economic boom.” But is that really what’s happening?
I get it. The numbers look bad. Since Trump took office in January 2025, the economy has added somewhere around 10,000–15,000 jobs per month on average, depending on how you cut the start date—and that’s after the annual benchmark revision that slashed 2025’s full-year job growth from +584,000 to just +181,000. In 2024, the benchmarked average was about 120,000 per month (the pre-revision number was closer to 170,000, which is what most people remember). That’s a dramatic deceleration by any measure.
But here’s the thing: the denominator has changed. Dramatically. And almost no one writing panic headlines is adjusting for it.
(This is probably a dangerous article that might age like milk when Iran’s oil situation might actually plunge the world into a recession, but there have been so many breathless takes citing job numbers that I feel like I need to write this. I get an insatiable itch to write about this stuff when people obviously misinterpret or misrepresent economic stats.)
The Breakeven Number Has Collapsed
There’s a concept in labor economics called “breakeven employment growth”—the number of new jobs the economy needs to create each month to keep the unemployment rate stable. It’s not a fixed number. It depends on how fast the working-age population is growing, which depends on births, deaths, retirements, and—critically—immigration.
In 2024, breakeven was somewhere around 130,000–230,000 jobs per month, depending on which model and time horizon you used. The San Francisco Fed estimated that the short-run breakeven got as high as 230,000 during the immigration surge, while the long-run breakeven was closer to 70,000–90,000. The economy needed to create a lot of jobs just to absorb new entrants into the workforce—immigrants arriving, young people aging in, and people coming off the sidelines.
That number has collapsed.
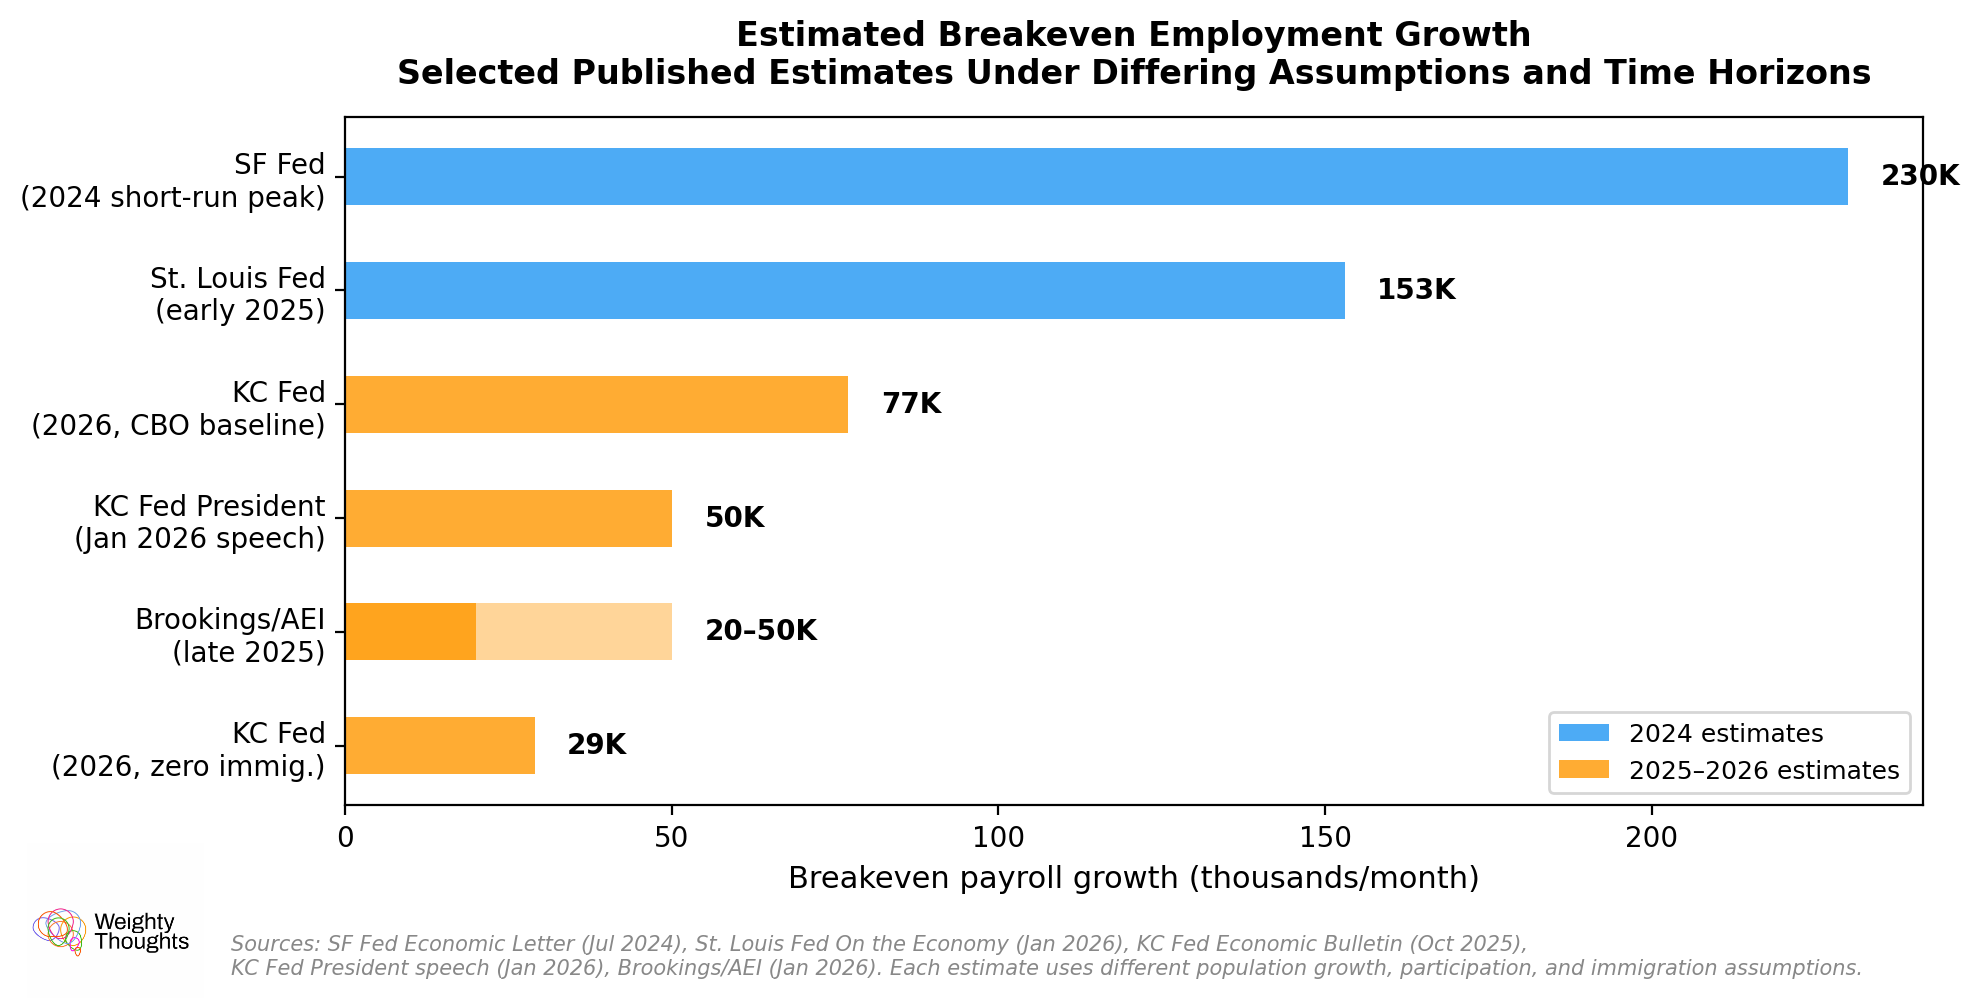
The Kansas City Fed’s research, using CBO population projections for 2026, estimates a breakeven range of roughly 29,000 to 77,000 depending on assumptions about immigration’s contribution. KC Fed President Jeff Schmid said in January that his staff’s estimates put breakeven “in the vicinity of 50,000 jobs per month.” In their January 2026 update, Brookings and AEI estimated a breakeven range of 20,000 to 50,000 for late 2025, and noted it could dip negative in 2026 as immigration slows further.
Let’s sit with that for a second. A year and a half ago, the economy may have needed 200,000+ new jobs a month to stay in equilibrium. Now it might need somewhere between 30,000 and 70,000, depending on whose model you trust. That means a payroll print of 50,000—which would have been terrifying in 2023—is around or modestly above breakeven under several current estimates.
Why? Immigration Fell Off a Cliff
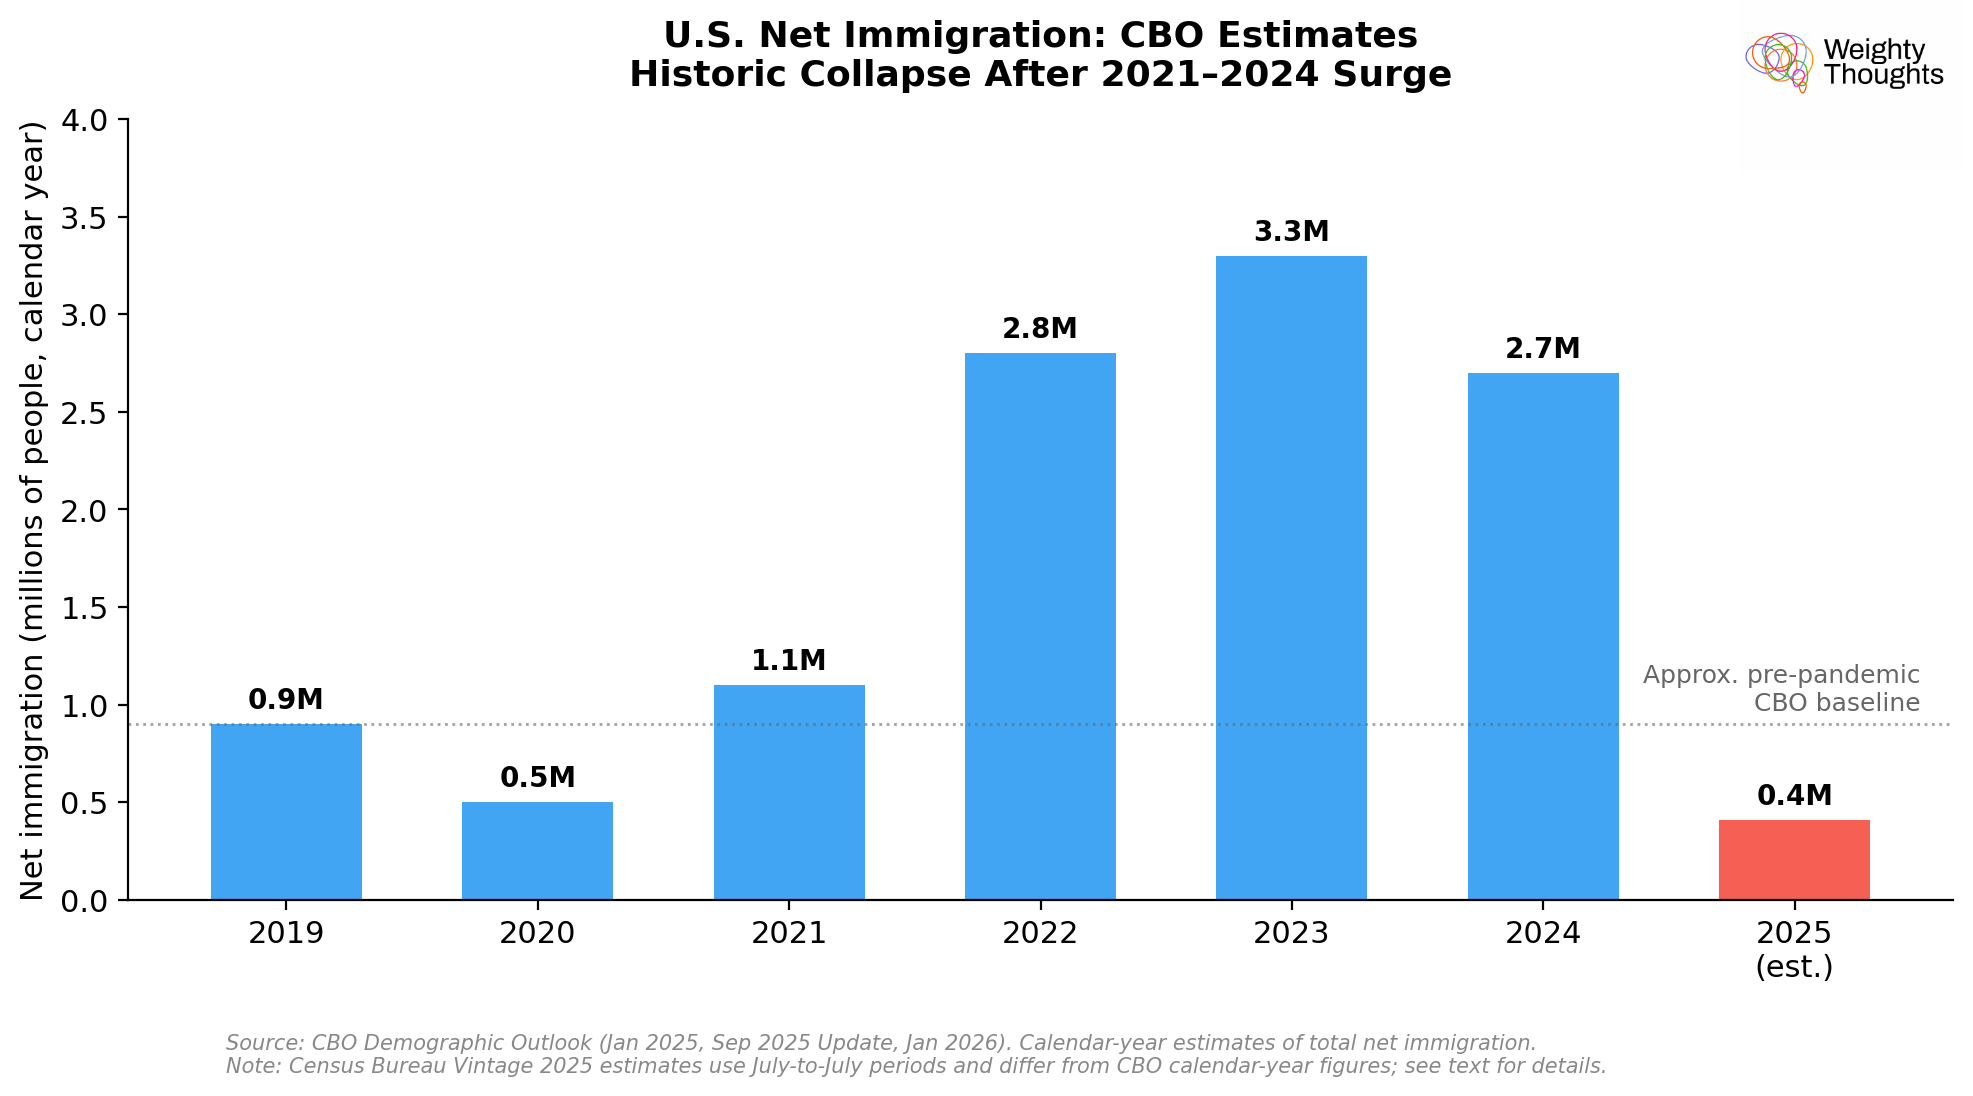
The Census Bureau released population estimates in January that tell the story plainly. Net international migration dropped from 2.7 million in the year ending July 2024 to 1.3 million in the year ending July 2025—a 54% decline. If current trends continue, the Census Bureau projects net migration will fall to roughly 321,000 by July 2026. That would be another decline of nearly a million people.
The CBO’s projections tell a similar story through a different lens. Compared to their January 2025 baseline, they now project net immigration to be 1.6 million people smaller in 2025 and 960,000 smaller in 2026. Their latest demographic outlook estimates that net immigration declined to about 410,000 in calendar year 2025—a fraction of the 3.3 million they estimated for 2023.
(A quick note on the numbers: CBO uses calendar-year estimates, while the Census Bureau uses July-to-July periods, and their methodologies differ. The specific figures don’t line up perfectly. But the directional story is the same across both: a historic collapse in immigration flows.)
These are enormous swings. We went from a period of historically elevated immigration to what might be the lowest levels in decades. The Census Bureau’s own analysis notes that current trends are “trending toward negative net migration” and that if they continue, “it would be the first time the United States has seen net negative migration in more than 50 years.”
Fewer people entering the country means fewer people entering the labor force. Fewer people entering the labor force means you need fewer jobs to keep the unemployment rate from rising. It’s a lot of stats and numbers, but the concept is really pretty straightforward.
So Where Does That Leave Us? Not Great, But Not Bad
Let me be clear about where the labor market actually sits, because it’s not a clean story in either direction.
The February report was genuinely distorted. A Kaiser Permanente strike involving about 31,000 workers in California and Hawaii hit during the BLS survey week, and healthcare employment swung to -28,000 for the month—after averaging roughly +30,000/month over the prior year. The strike has since been resolved. Federal government employment also dropped by 10,000, continuing a trend that’s taken 330,000 federal jobs off the books since October 2024—an 11% reduction.
Strip out the strike effects and the federal workforce reduction, and the underlying picture looks more like stagnation than contraction. Look at the chart: most of the monthly bars in 2025 and early 2026 are bouncing around in the zone between the old breakeven and the new one. Against the 2024 standard, they look terrible. Against the current breakeven estimates, they look like what they are—a labor market roughly treading water.
But stagnation is not great, either. Average unemployment duration rose to 25.7 weeks in February—a multi-year high. If you’re out of work, you’re staying out of work longer. The job-finding rate has clearly deteriorated. And the Minneapolis Fed published an important analysis in October 2025 arguing that immigration declines can only explain about 40–60% of the slowdown in payroll growth—the rest reflects genuinely weaker labor demand.
They found that states and sectors with fewer unauthorized workers actually saw bigger employment declines, which is the opposite of what you’d expect if immigration were the whole story. They also found that real wage growth has slowed more for low-wage workers—who should be benefiting most from less competition if immigration were the only story—which points to a broadly cooling labor market, not just a supply-side adjustment.
That’s a meaningful finding. It means the labor market is softer than just the immigration math alone would suggest, but not as soft as the headline payroll numbers imply.
So, as per my usual admonition... it’s nuanced.
NEC Director Kevin Hassett made the same basic argument after the February report, saying breakeven is probably in the 30,000–40,000 range and that current job growth is consistent with a strong economy. I wouldn’t go quite that far—a “strong economy” doesn’t usually produce negative payrolls and rising unemployment duration—but the basic arithmetic is directionally right.
The St. Louis Fed put it well: “the biggest swing factor in the breakeven growth rate is the population growth rate.” And the population growth rate just changed enormously.
Putting it all together, the labor market is mediocre. Not in free fall. Not strong. Not terrible. It’s somewhere in the zone where the economy is creating enough jobs to roughly keep pace with the (much smaller) population inflow, but without enough surplus to actually pull unemployment down or create the kind of dynamism you associate with healthy expansion.
It’s a low-growth equilibrium—stable, but fragile. (Ah, fortunately there isn’t something like a global oil shock and war going on in the Middle East...)
Why This Matters Beyond the Monthly Number
There are two broader implications worth flagging.
First, the Fed. If breakeven really is somewhere in the 30,000–70,000 range, then the gap between what the economy is producing and what it needs is smaller than the headlines suggest. That weakens the case for aggressive rate cuts. The labor market isn’t tight, but it’s not collapsing either—and cutting rates won’t conjure up missing immigrants. The supply side of the economy has become the binding constraint, and monetary policy is a demand-side tool. Rate-cut expectations have shifted toward mid-year, but the Fed has been explicitly cautious, and this data doesn’t clearly force their hand.
Second—and this connects to what I wrote last week about AI and the pipeline problem—a labor market with structurally lower breakeven creates an environment where organizations can more easily justify not hiring. If you only need 30,000–50,000 jobs a month to keep unemployment flat, every marginal hire feels less urgent. Senior people with AI tools can handle more. The junior pipeline narrows further. The demographic math is giving companies cover to do what many were already inclined to do: run leaner and let attrition do the work.
That’s not a disaster today. But it will be! Fewer people entering, fewer people being trained, fewer people developing the judgment layer that makes them effective evaluators of AI output—it’s the same pipeline problem I described in “AI Agents and Jobs”, now with a demographic accelerant.
After all, we aren’t uniformly not hiring across the population. I assert that we’ll likely see greater unemployment among younger cohorts if AI really starts to get widely adopted. Despite some headlines that this is already happening, the actual evidence is mixed (which I won’t deep dive on here—the short summary is we’ll need to wait and see).
The Bottom Line
I think I’m fulfilling my brand here of being boringly level-headed. It’s certainly less of a sexy, clickbait article to be saying that there’s nothing much to write home about in terms of the economy vs. screaming that the sky is falling from AI.
Let’s be clear: the jobs numbers aren’t good. The White House trying to jawbone it into being “strong” doesn’t make it so. But they aren’t the crisis that various articles (and certain Substacks) are declaring. And really, it’s unlikely to be actually driven by AI given lag times and actual adoption so far. I don’t think the Fortune 500 are using agents in the same way power users are.
The single most important piece of context is that breakeven employment growth has fallen dramatically—from perhaps 200,000+ to somewhere in the 30,000–70,000 range—in the span of about a year, driven primarily by a historic decline in net immigration. A payroll print that would have been alarming in 2024 is merely mediocre in 2026.
So, all told, the labor market is cooling, not cratering. The Minneapolis Fed is right that there’s genuine demand weakness beyond just the immigration effect. But the people telling you the sky is falling are reading the thermometer without noticing that they moved to a different climate.
We’ll obviously have to keep monitoring—the March report drops April 3rd, and the Kaiser strike effects should wash out. If payrolls remain negative after that, the “it’s just distortions” argument gets harder to make. But for now, the most defensible read is that we’re in a low-growth equilibrium, breakeven has fallen dramatically, and the labor market is roughly treading water in a pool that’s gotten a lot smaller.
Do I think there won’t be disruption from AI? No, I think it will be disruptive. But the way these things work their way through the economy is complicated. And this isn’t it.
(And... once again... Iran, oil, war...)
Thanks for reading!
I hope you enjoyed this article. If you’d like to learn more about AI’s past, present, and future in an easy-to-understand way, I’ve published a book titled What You Need to Know About AI.
You can order the book on Amazon, Barnes & Noble, Bookshop, or pick up a copy in-person at a local bookstore. If you’re in Southern California, I’ll be at Lido Village Books in Newport Beach, CA this Thursday 3/26 from 4-6pm signing books in person if you’re around and want to say hi!

Another great article. It sounds very reasonable to me. I asked Gemini to produce a graph of immigration over the last 20 years. Unfortunately, it wouldn't allow me to simply paste it here.
It reported "There has been a historic increase in net immigration starting in 2021. According to CBO estimates, net immigration reached record highs of approximately 3.3 million people annually in both 2023 and 2024." From the graph, it is evident that immigration isn't crashing, it's just normalizing. It would be helpful for some topics like the focus here on immigration to show a graph of immigration over the last 20 years in the article. Just a suggestion.
Immigration Fell Off a Cliff - title is correct. It's because instead of filing for H1 they are hiring in other off shore places...that way it looks like collaboration between 2 nations minus the H1 numbers drama. See if you can find graphs showing trends of off shore hiring done by US companies.